


Always-On Visibility
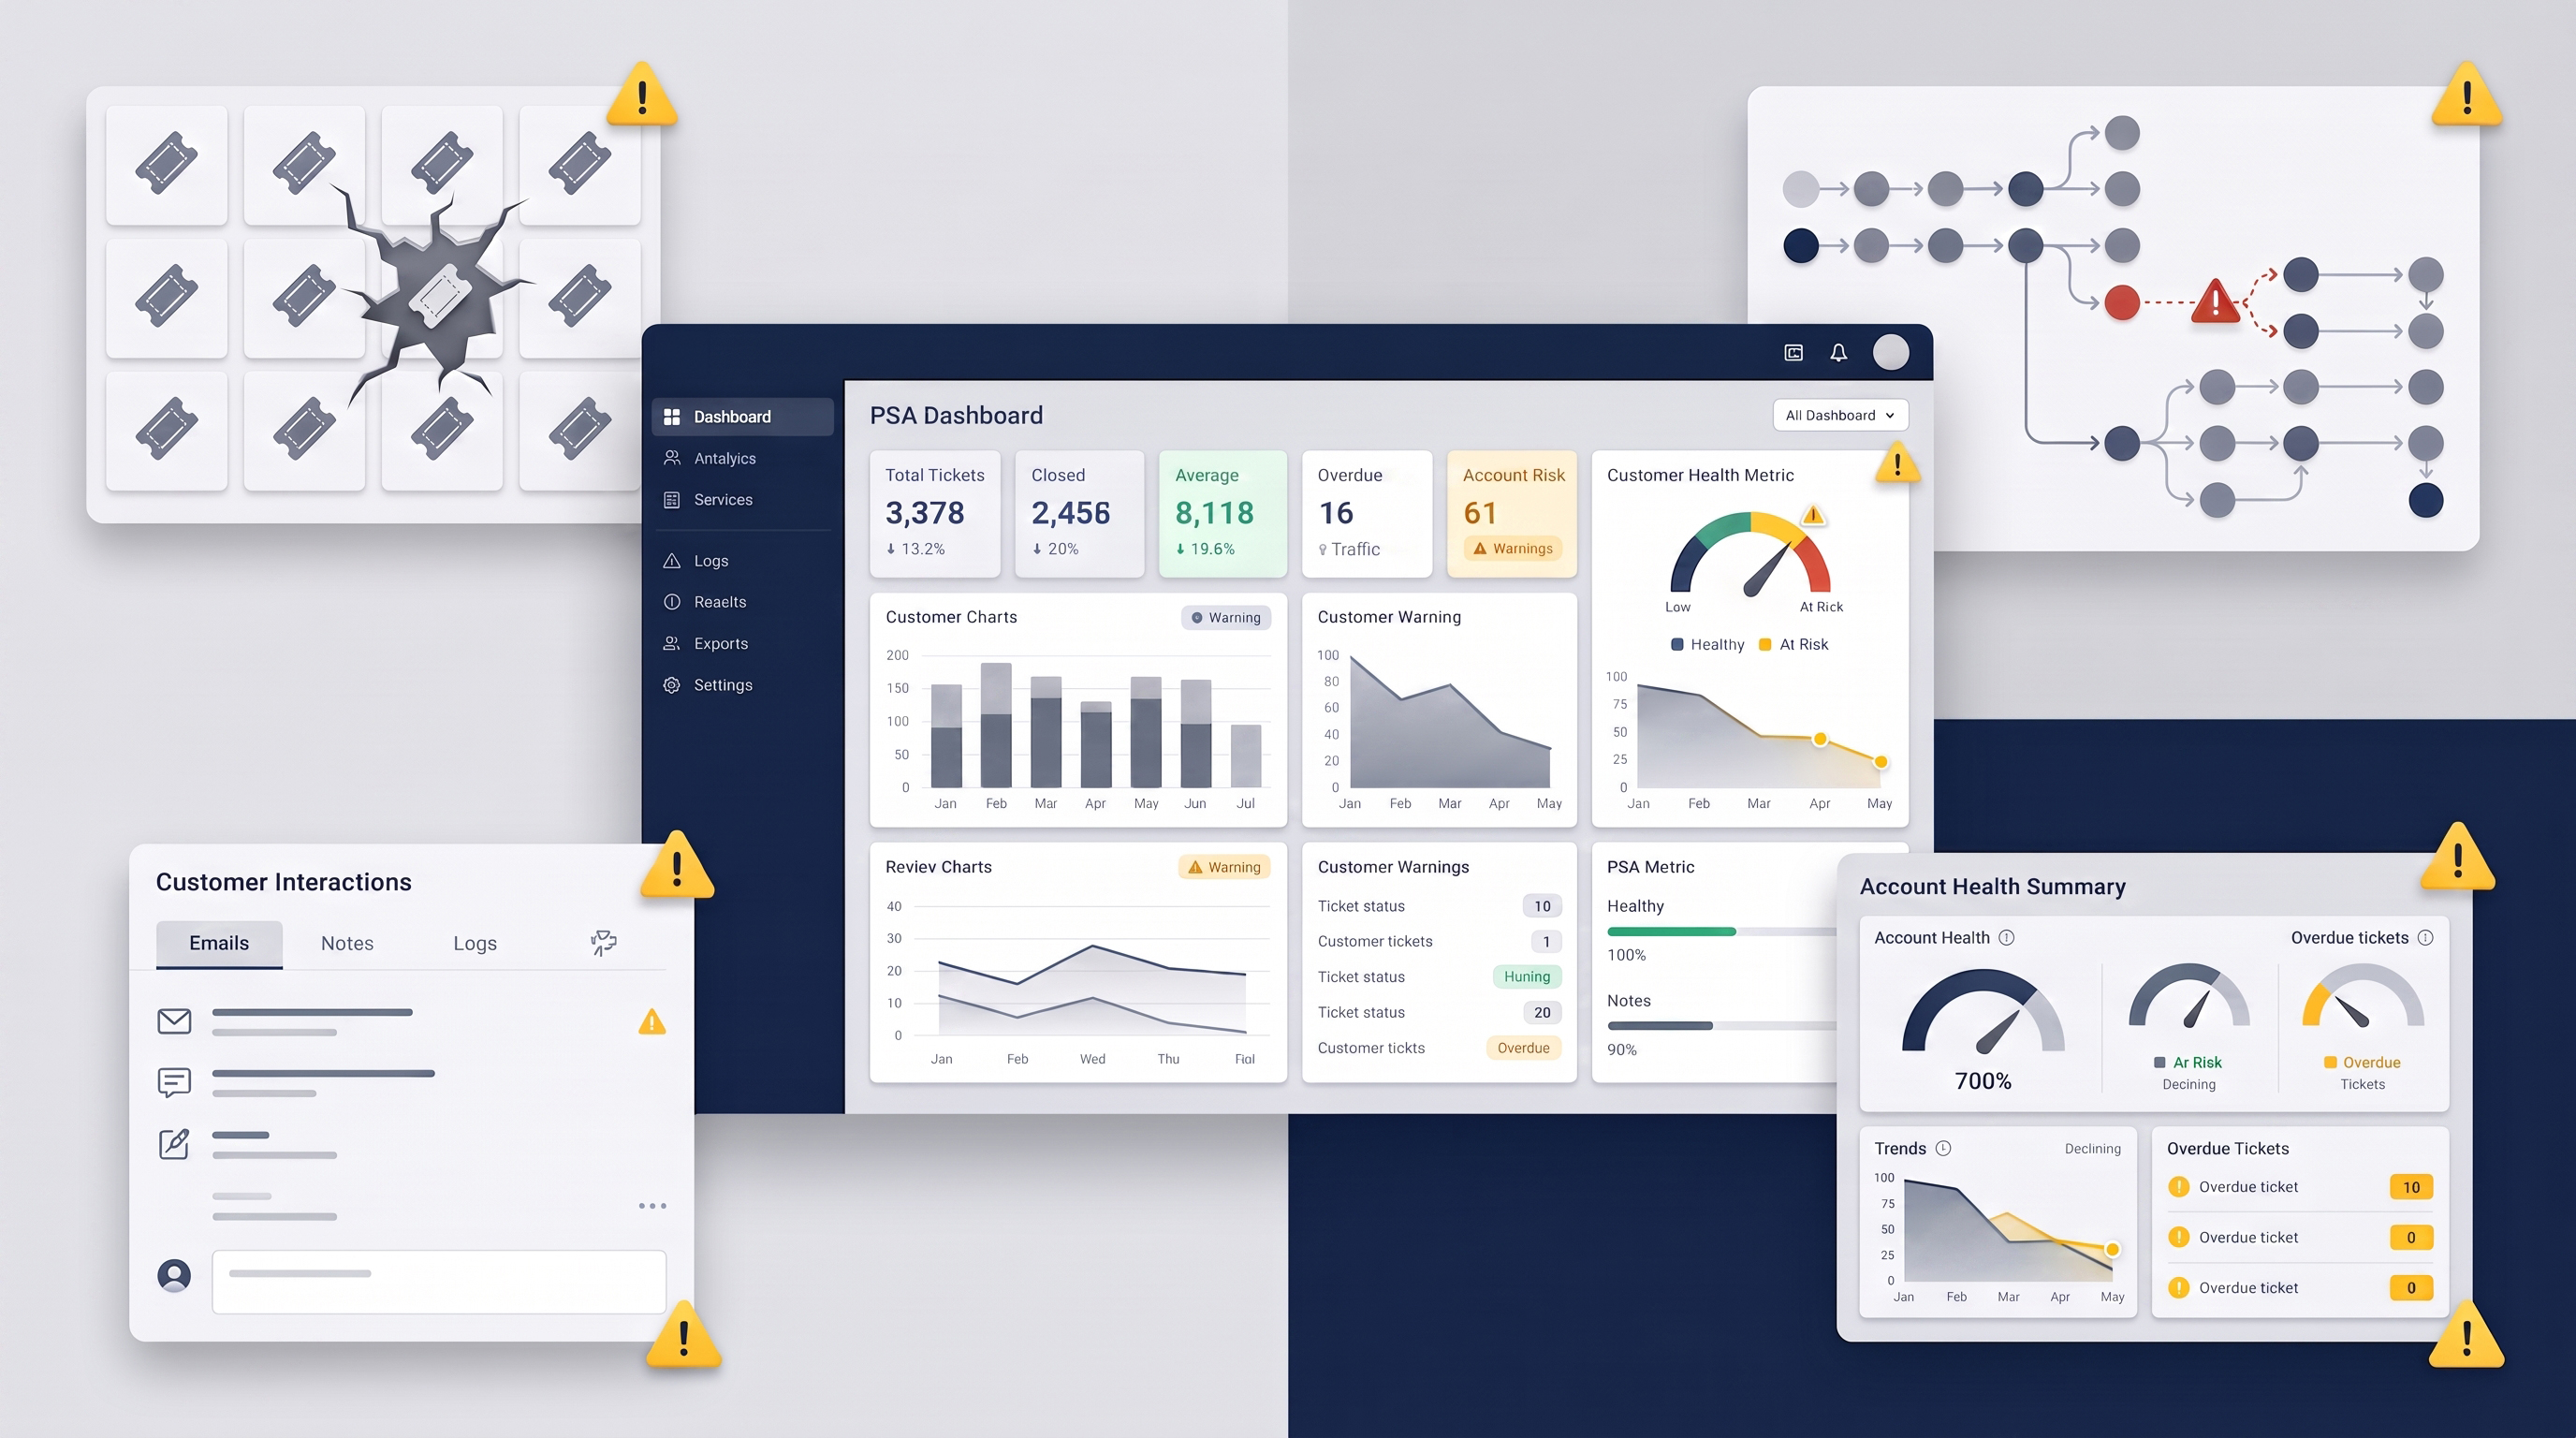
Whether you're reviewing timesheets, running reports, or working through open tickets, the Dashbar stays visible at the top of the portal. Every level of your organization, from technicians to owners, can see the real-time health of the business and jump on urgent issues immediately.
Color-Coded, At a Glance
The Dashbar uses simple color indicators: green, yellow, and red, so priority is obvious without digging through menus. Orange means "handle this soon." Red means "handle this now."
Key indicators include:
- New Tickets - status of tickets clients have just submitted
- Tickets Near SLA Failure - flags anything at risk of breaching an SLA
- Average Urgency Score - a Zest-exclusive metric showing the overall urgency of your open ticket queue
- Customers Needing Interaction - tells you exactly who to reach out to, and when, to protect satisfaction and retention
Built for Daily Use, Not Just Reporting
Because the Dashbar is visible everywhere in the product, it naturally keeps teams focused on ending the day "all green", which means no red or orange indicators left in the queue. That's the kind of daily discipline that keeps SLAs met and clients happy.
See the Dashbar in Action
If this sounds like the visibility your MSP has been missing, schedule a demo or start a free trial today.
.jpg)